


In a nutshell, a risk-adjusted return is exactly what it sounds like; a return calculation that takes into account the degree of risk you are taking on to achieve that return. Higher returns, almost by definition, mean higher risk, so the purpose of a risk-adjusted return is to determine whether that risk is worth the expected reward.
A crucial point to keep in mind about any risk-adjusted return is that it’s usually measured against the risk-free rate like the 10Y US Treasury. Because a US Treasury offers a “risk-free” return any investor can earn, all riskier assets, meaning all other assets, must offer a higher return proportionate to their level of risk if they are to lure any investors into buying them instead of a risk-free asset.
And for simplicity’s sake, risk can be thought of as the standard deviation of any investment, which basically just means the maximum drawdown you can expect while holding it. Even though Treasury values have their ups and downs like any other investment, the return at the end of the duration is guaranteed by the Government, who has a money printer. Other investments, however, are not backed by such a reliable guarantor, so standard deviation and the potential for loss have to be factored in when weighing any expected return against the risk-free rate.
Some very broad examples of how assets are viewed through the lens of risk adjustment include corporate bonds as a default-adjusted risk-free rate and equities as the risk-free rate + the equity risk premium, which essentially just means the standard deviation risk.
A useful formula for calculating any risk-adjusted return is the Sharpe ratio. Say, for example, the risk-free rate was 3% and an investment’s expected return was 8% with a standard deviation of 5%. You would take that 8% expected return and subtract the risk-free rate of 3% to get 5%. You would then divide that 5% by the standard deviation of 5 to get a 1.0 Sharpe ratio. (5 ÷ 5)
Now take another investment with an expected return of 7% and a standard deviation of 3% to do the same thing. 7% expected return - 3% risk-free rate = 4, 4 ÷ a 3% standard deviation = a Sharpe ratio of 1.33. So, even though the expected return for the first investment was higher at 8%, the risk-adjusted return was lower.
This is why calculating risk-adjusted returns is so important. Just because an investment has a high expected return doesn’t mean it has a worthwhile risk-adjusted return. If one investment was expected to deliver 2x the return of another but was 3x as risky, meaning it had 3x the standard deviation or default risk, a risk-adjusted return would probably steer you away from it.
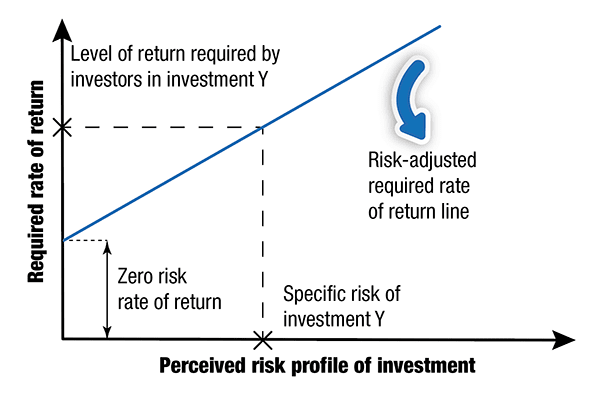
And aside from this being a useful tool for your own investing, it’s important to understand how the concept of risk-adjusted returns influences other investors in the market. As perceived risk goes up, investors demand higher returns to compensate them for that risk they are taking on, which could steer them away from riskier assets and toward safer ones. But as perceived risk goes down, investors will be more satisfied with modest returns beyond the risk-free rate, and, as a consequence, be more willing to go further out on the risk spectrum.
Bottom line, expected return means nothing if it isn’t viewed in the context of risk, so adjust your expected return and weigh that against every other investment, including the risk-free rate, to make wiser and more accurate investment decisions.


